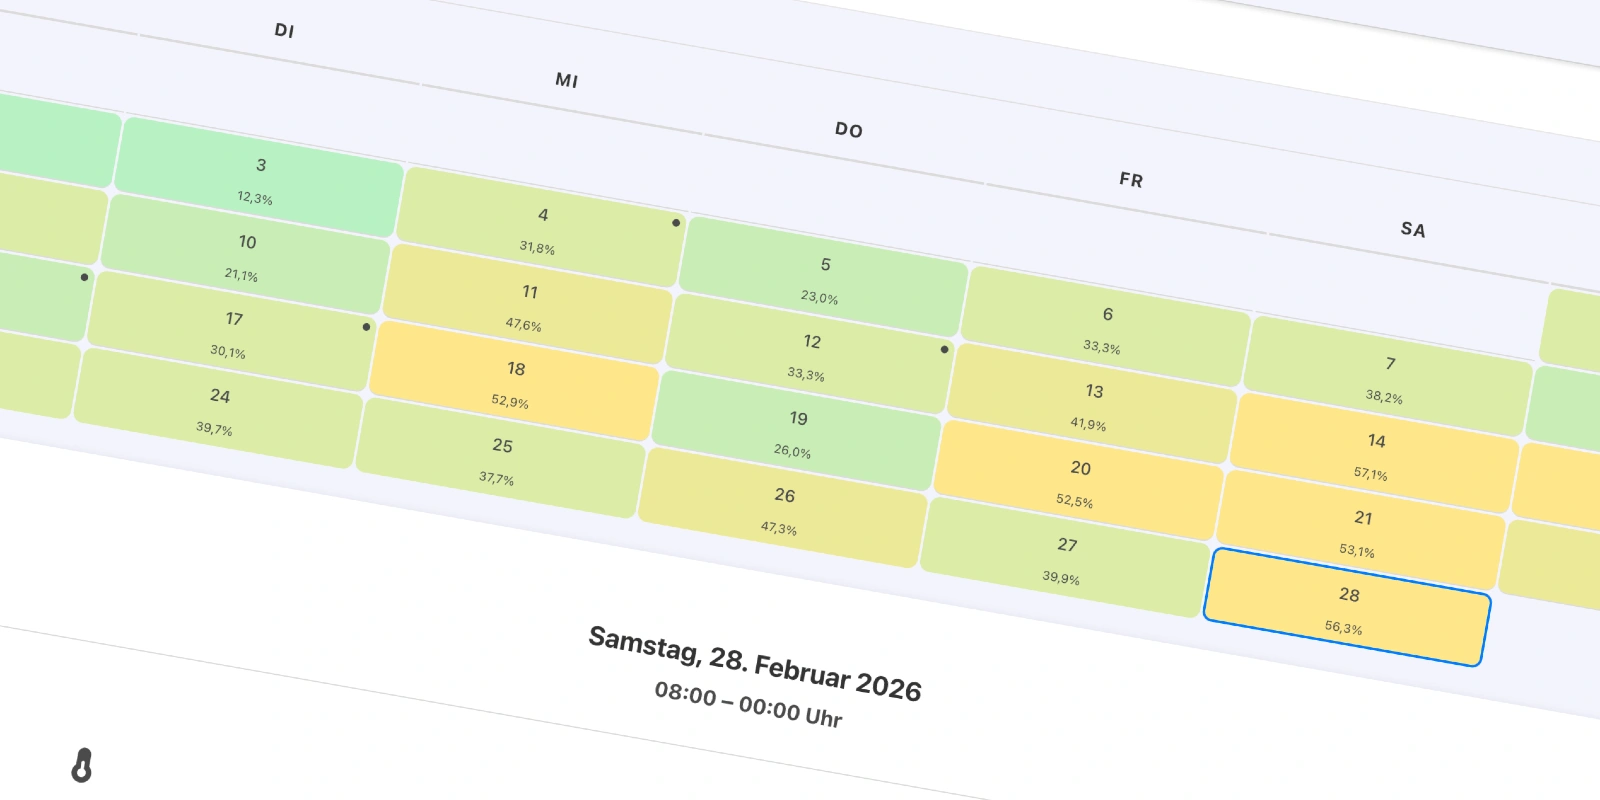
Disneyland fans who visited the park in February 2026 enjoyed mostly moderate wait times. The average wait across all attractions came in at around 20 minutes. Crowds stayed between 25 and 45 percent capacity on most days, creating a pleasant, easy-to-plan atmosphere for families. The quietest day was February 3, with just 12.3 percent capacity and an average wait of only 12.3 minutes. The busiest was February 14, with 57.1 percent capacity and 26.7 minutes average wait.
External Factors: Holidays and Weather
Several U.S. holidays clearly shaped crowd levels. On February 1, National Freedom Day, crowds hit 32.4 percent. Groundhog Day on February 2 kept things very low at 15.5 percent. Rosa Parks Day on February 4 brought 31.8 percent, Lincoln’s Birthday on February 12 delivered 33.3 percent, and the Bridge Day on February 13 reached 41.9 percent. Valentine’s Day on February 14 pushed crowds to the monthly high of 57.1 percent. Surprisingly quiet was George Washington’s Birthday on February 16 with just 21.4 percent. Mardi Gras on February 17 saw 30.1 percent, and Ash Wednesday on February 18 hit 52.9 percent. On days with strong holiday participation, the average crowd level was 35 percent.Weather had an even bigger impact. Temperatures mostly ranged from 15 to 27 °C. On dry, mild days above 20 °C with winds under 8 km/h – like February 1 (21.5 °C, 0 % rain, 6.8 km/h) or February 4 (25.7 °C, 0 % rain, 10.2 km/h) – crowds exceeded 31 percent. The effect was strongest on February 27 (27.1 °C, 0.6 % rain, 39.9 % crowds) and February 28 (22.9 °C, 56.3 % crowds). On wet, windy days like February 16 (12.5 °C, 66.6 % rain, 37.6 km/h wind), crowds dropped to just 21.4 percent. February 19 (11.7 °C, 28.4 % rain) saw 26 percent. Dry mild days averaged 38 percent crowds, while unpleasant days averaged only 26 percent.
Weekly and Daily Patterns
The park followed a clear weekly rhythm. Mondays had 27.6 percent capacity with 17.8-minute waits, Tuesdays were even quieter at 25.6 percent and 16.6 minutes. Wednesdays rose to 42.7 percent (22 minutes), Fridays to 41.6 percent (21.1 minutes). Saturdays were the busiest at 51.2 percent with 24.4-minute waits, while Sundays sat at 38.9 percent (21.3 minutes).Crowds started rising slowly from 9 a.m., peaking between 10 a.m. and 4 p.m. at 40 to 41 percent before dropping sharply below 30 percent after 8 p.m. Wait times followed the same pattern: around 21 minutes from 10 a.m., peaking at 24.7 minutes between 3 and 4 p.m., then down to 16.5 minutes after 8 p.m. and under 14 minutes after 10 p.m. On holidays like February 14 crowds stayed higher all day, while on rainy days like February 16 waits remained low even midday.
Attractions in Detail
Star Wars: Rise of the Resistance topped the list with an average wait of 61 minutes. Peak waits hit 89.2 minutes on February 15 and 81.5 minutes on February 14, with the shortest at 49 minutes on February 17. Wednesdays averaged 59.3 minutes and Saturdays 68.6 minutes. On mild days waits were about 10 minutes longer.Space Mountain followed at 50.4 minutes average, with peaks of 68 minutes on February 21 and 67.9 minutes on February 14, and a low of 31.8 minutes on February 3. Saturdays saw 62.4 minutes.
Indiana Jones Adventure averaged 43 minutes, with peaks on February 21 (60.7 minutes) and February 15 (59.7 minutes). Matterhorn Bobsleds averaged 35.8 minutes, peaking at 75.4 minutes on February 14.
Mickey & Minnie's Runaway Railway reached 31.6 minutes (peak 43.3 minutes on February 28), Big Thunder Mountain Railroad 32.8 minutes (peak 43.8 minutes on February 14), Haunted Mansion 29.4 minutes (peak 42 minutes on February 14) and Peter Pan's Flight 31 minutes. Roger Rabbit's Car Toon Spin averaged 30.3 minutes.
Tiana's Bayou Adventure had 24.9 minutes average, peaking at 61.7 minutes on February 28. Star Tours averaged 24.3 minutes, Millennium Falcon: Smugglers Run 23.6 minutes, Alice in Wonderland 22.3 minutes, Mickey's House and Meet Mickey Mouse 22.1 minutes and Chip 'n' Dale's GADGETcoaster 21 minutes.
Dumbo the Flying Elephant averaged 19.3 minutes, Pirates of the Caribbean 18.2 minutes, Astro Orbitor 17 minutes, Autopia 16.4 minutes, Buzz Lightyear Astro Blasters 16 minutes, Mr. Toad's Wild Ride 14.7 minutes, Jungle Cruise 14.5 minutes, Storybook Land Canal Boats 14.2 minutes, Snow White's Enchanted Wish 13.3 minutes, Finding Nemo Submarine Voyage 12.8 minutes, "it's a small world" 11.2 minutes and The Many Adventures of Winnie the Pooh 10.4 minutes. Sailing Ship Columbia and Mark Twain Riverboat both averaged 10 minutes. Disneyland Monorail averaged 7.3 minutes, Disneyland Railroad 7.1 minutes, Casey Jr. Circus Train 8.2 minutes, King Arthur Carrousel 6.1 minutes, Pirate's Lair on Tom Sawyer Island 5.2 minutes, Adventureland Treehouse 5 minutes and Davy Crockett's Explorer Canoes 7.1 minutes.
Optimal Visit Patterns and Practical Tips
The best days for short waits were February 3, February 2 and February 16, with averages under 16 minutes. Mondays and Tuesdays were generally the most efficient. If you’re planning around holidays like February 14 or 16, arrive early or check the forecast. When temperatures are forecast above 20 °C with low rain and light winds, head in after 8 p.m. – waits then drop below 17 minutes park-wide. Thrill rides like Star Wars: Rise of the Resistance, Space Mountain or Indiana Jones Adventure run shortest in the first two hours after opening or in the evening. Family favorites like Dumbo or Peter Pan's Flight are best tackled mornings or evenings. When winds top 25 km/h or rain exceeds 30 percent, outdoor rides like Matterhorn or Big Thunder Mountain are noticeably emptier.To the Crowd Calendar: Februar 2026