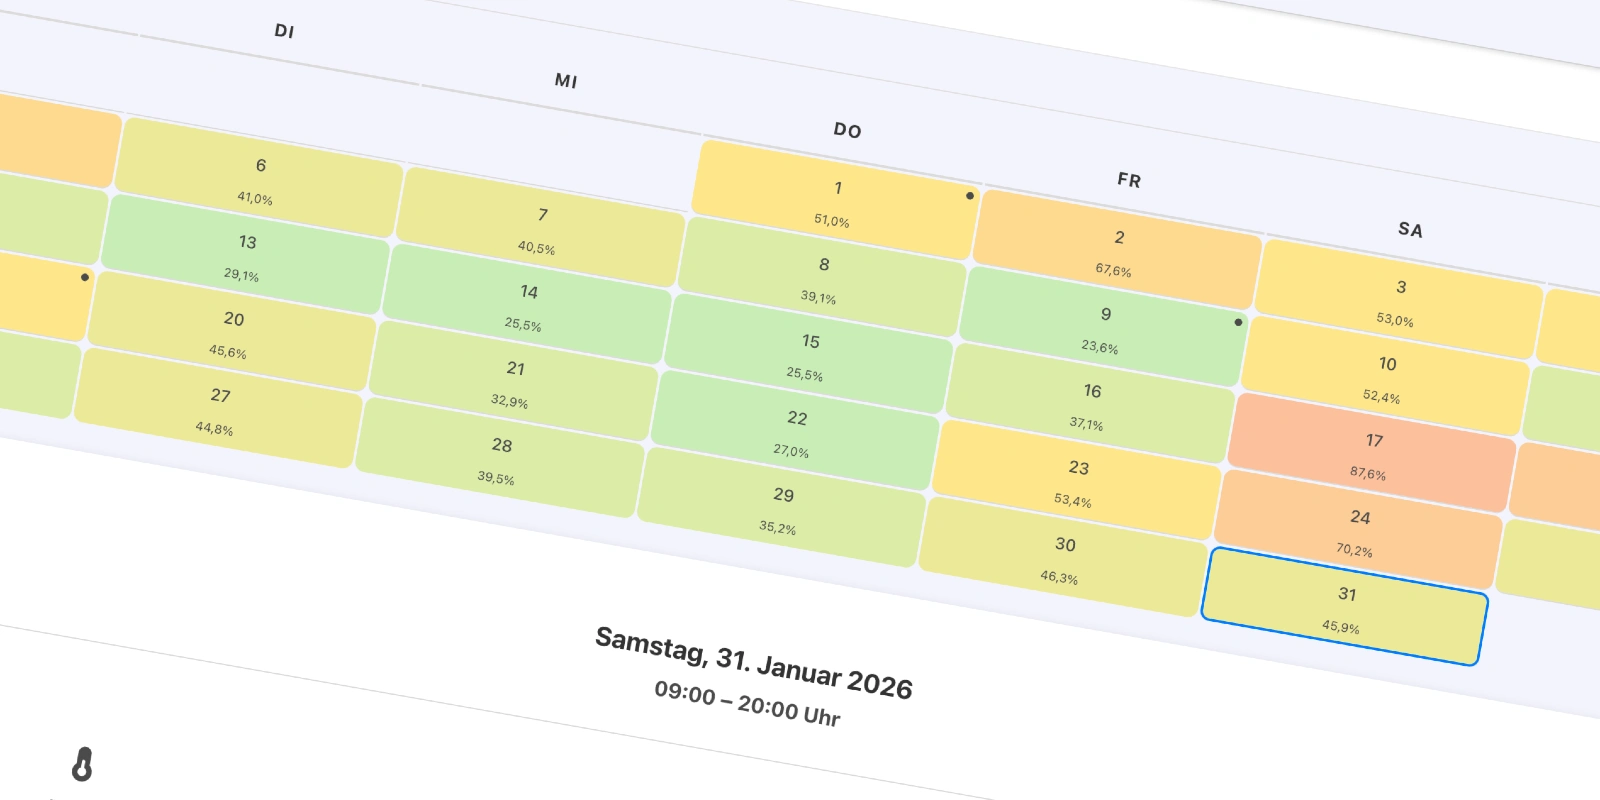
January 2026 at Universal's Islands of Adventure delivered a fascinating lesson in crowd dynamics for every theme park fan planning their next Orlando trip. Daily attendance fluctuated dramatically between a very low 23.6 percent on January 9 and a very high 87.6 percent on January 17, with corresponding park-wide average wait times ranging from just 21.8 minutes to a full 60 minutes.
Holidays, weather and weekdays shaped the month significantly. On New Year’s Day (January 1), attendance stood at 51.0 percent with an average wait of 35.7 minutes, rising to 67.6 percent and 43.7 minutes on the following bridge day (January 2). Three Kings’ Day (January 6) was calmer at 41.0 percent and 30.9 minutes, while Lee-Jackson Day (January 9) turned out to be the quietest day with only 23.6 percent attendance and an excellent 21.8-minute average wait. Martin Luther King Jr. Day (January 19) reached a moderate 55.6 percent with 41.1 minutes, and Kansas Day (January 29) stayed low at 35.2 percent and 29.2 minutes.
Dry days (0 % rain) averaged 45.3 percent attendance with 34.9-minute waits, while days with over 15 % rain showed a range of 25.5 to 70.6 percent attendance and waits between 22.6 and 48.0 minutes. Temperature had only limited impact: buckets under 15 °C averaged 41.2 percent, 15–22 °C 44.8 percent and above 22 °C 43.9 percent.
A very stable weekly and daily pattern emerged. Saturdays reached an elevated 61.7 percent attendance with 43.0-minute waits, followed by Sundays at 52.9 percent and 36.8 minutes, Mondays at 49.0 percent and 36.9 minutes, and Fridays at 47.2 percent and 34.0 minutes. Tuesdays (40.4 % / 31.1 min), Wednesdays (35.1 % / 28.4 min) and Thursdays (36.5 % / 29.0 min) remained in the low-to-moderate range. Hourly, attendance rose from 10:00 a.m. to 51.9–53.1 percent and stayed at 45.7–48.0 percent until 4:00 p.m., with a second peak around 8:00 p.m. at 66.5 percent. Park-wide average wait time peaked between 11:00 a.m. and 12:00 p.m. at 39.4–40.3 minutes and dropped steadily after 7:00 p.m. to just 15.0 minutes by 10:00 p.m.
Attraction Highlights
Hagrid's Magical Creatures Motorbike Adventure clearly dominated as the biggest magnet and bottleneck, with a monthly average wait of 161.3 minutes. Even on the quietest day (January 9), the line stood at 133.4 minutes and climbed to 197.8 minutes on January 17. Jurassic World VelociCoaster followed with a 70.7 minutes average and strong peaks up to 126.9 minutes on January 17, while Flight of the Hippogriff reached 56.2 minutes and Pteranodon Flyers 43.0 minutes – both clearly correlated to overall crowd levels. The Grinch Meet & Greet at Honk Honkers hit 99.8 minutes (measured on only a few days). Harry Potter and the Forbidden Journey averaged 30.0 minutes standard but only 7.0 minutes in the Single Rider lane. The most efficient attractions, even on busy days, remained Popeye & Bluto's Bilge-Rat Barges (6.6 minutes), Storm Force Accelatron (7.0 minutes) and Jurassic Park River Adventure (8.6 minutes), all staying under 15 minutes on very high-attendance days.Heatmaps and Sweet Spots delivered even more valuable insights. Hagrid's showed the lowest waits around 7:00–8:00 a.m. (131.1–141.5 minutes) and again around 9:00–10:00 p.m. (101.9 and 63.8 minutes, respectively). VelociCoaster stayed under 22 minutes in the early morning 7:00–8:00 a.m. window and dropped to 50.4 minutes after 9:00 p.m. Flight of the Hippogriff was under 17 minutes before 9:00 a.m. and under 23 minutes after 9:00 p.m. Harry Potter and the Forbidden Journey (Single Rider) stayed under 9.2 minutes all day long. Doctor Doom's Fearfall recorded the strongest hourly increase from 9.4 minutes at 8:00 a.m. to 32.6 minutes at 11:00 a.m. Dudley Do-Right's Ripsaw Falls and Jurassic Park River Adventure had their lowest values before 11:00 a.m. and after 5:00 p.m.
Best Visiting Strategies
The data reveals clear optimal patterns: The most efficient days were January 9 (21.8 minutes at 23.6 percent attendance) as well as January 13–15 and 21–22 with low-to-moderate crowds and waits under 28 minutes. Golden park-wide time windows were 7:00–9:00 a.m. and after 7:00 p.m., when average waits dropped below 30 minutes. For Hagrid's and VelociCoaster, the first and last operating hours offered deltas of up to 100+ minutes compared to peak times. Saturdays, January 17, and the MLK weekend required the earliest possible arrival for the top attractions, while Wednesdays, Thursdays and January 9 delivered the most stable and shortest waits across all rides. Single Rider options at Forbidden Journey and Spider-Man reduced waits to under 40 percent of the regular value on all higher-attendance days – a true game-changer for efficient touring.To the Crowd Calendar: January 2026