In February 2026 Disneyland Paris followed a very clear pattern. Early in the month crowds stayed very low, but once the winter school holidays kicked in they climbed to elevated and sometimes significantly higher levels. This in-depth look back gives fans who are planning trips – or just curious about real conditions – genuinely useful insights. Pick the right days and hours, and your visit feels so much more relaxed.
The month got off to a quiet start, with crowd levels between 17 and 37 percent in the first days. The lowest point came on February 13: just 12.5 percent crowds and an average wait of only 13.7 minutes, the shortest of the whole month. By February 24 things had changed dramatically – 68.2 percent crowds and 30.6 minutes average wait, the busiest the park got. Across all days the average wait time worked out at around 21 minutes.
External Influencing Factors
France had only one holiday in February: Valentine’s Day on the 14th, which touched 100 percent of the population but wasn’t a day off. Even so, crowds jumped to 40.9 percent that day with 22.1-minute waits, up from 12.5 percent the day before. The real driver, though, was the school holiday schedule. From February 8 to 14, 33 percent of students in Zone A were off, pushing crowds to between 17 and 46 percent. Between February 15 and 21 that share rose to 66 percent in Zones A and B, and crowds often sat between 35 and 69 percent. On the 17th, with 66 percent on break in both Zones, the park hit 69.2 percent crowds and 30.6-minute waits. February 22 saw 100 percent of students nationwide on holiday, resulting in 43 percent crowds and 23.6-minute waits. From the 23rd to the 28th, Zones B and C had 67 percent each, with crowds ranging from 31 to 68 percent. On the 24th – still only 67 percent – crowds reached 68.2 percent with 30.6-minute waits, while on the 27th they dropped back to 31.1 percent despite the same holiday percentage.Weather played a big part in amplifying these swings. Cold days below 5°C, such as February 14 (1.4°C, 14.5% rain, 29 km/h wind) or February 15 (2.7°C, 58.3% rain, 14.2 km/h wind), kept the park fairly empty at 40.9 and 35.6 percent respectively. Milder days between 5 and 10°C, like February 1 at 7.6°C or February 13 at 8.2°C with 77.9% rain, also stayed quiet. From February 21 onward temperatures often topped 10°C – think February 25 at 15.9°C with just 1% rain or February 24 at 13.2°C – and that helped push visitor numbers up. Heavy rain over 30 percent, like 77.9 percent on the 13th or 51.9 percent on the 11th with 45.1 km/h wind, noticeably thinned out the crowds. Wind above 20 km/h on the 11th, 12th and 16th had a similar calming effect. The real peaks came from the perfect storm of high holiday shares, mild temperatures and low wind, exactly as on February 24.
Weekly and Daily Rhythm
Mondays saw 41.8 percent crowds and 22.7-minute waits, Tuesdays were busiest at 48.9 percent and 24.6 minutes, Wednesdays 35.9 percent and 20.9 minutes, Thursdays 38.3 percent and 21.4 minutes. Fridays were easily the quietest with just 25.4 percent and 17.4-minute waits. Saturdays hit 45.4 percent and 23.7 minutes, Sundays 39.7 percent and 22.3 minutes. Throughout the day the crowds built up in the morning: 17.8 percent and 9 minutes at 8 a.m., already 42.3 percent and 15.2 minutes by 9 a.m., peaking at 43.6 percent and 26.9 minutes at 11 a.m. By 2 p.m. it was 46.8 percent and 25.5 minutes. After 5 p.m. numbers fell to 34.5 percent and 18.9 minutes, dropping further to 30.3 percent and 13.7 minutes at 8 p.m. and all the way down to 4.5 percent and 6.3 minutes by 10 p.m. On big holiday days like the 17th the high levels lasted longer; on windy or rainy days like the 13th the park stayed quiet from open to close.Attraction Details
Alice's Curious Labyrinth was the ultimate low-wait gem – a steady 5 minutes every single day, hour and weekday, completely unaffected by holidays, weather or Valentine’s Day. The heatmap was solid 5 minutes across the board.Big Thunder Mountain averaged 47.4 minutes for the month. Quietest on February 13 with 31.4 minutes at 12.5 percent crowds; busiest on February 24 with 67.3 minutes at 68.2 percent. Tuesdays were busiest at 52 minutes, Fridays calmest at 43.9 minutes. Hourly lows of 16 minutes at 8 a.m., highs of 59.2 minutes at 2 p.m. The ride was very sensitive to high holiday percentages from the 17th onward (over 55 minutes) and to the mild, dry days late in the month (over 60 minutes).
Blanche-Neige et les Sept Nains averaged 22.4 minutes. Shortest wait on February 2 at 15.5 minutes with 25.9 percent crowds, longest on February 26 at 30.4 minutes with 60.2 percent. Higher on Sundays (24.6 minutes), lower on Fridays (18.7 minutes). Just 7.6 minutes at 9 a.m., peaking at 29.5 minutes at 11 a.m.
Peter Pan's Flight topped the list with a 52.2-minute average – the longest wait overall. Shortest on February 3 at 39.6 minutes with 22.5 percent crowds; longest on February 24 at 68.6 minutes with 68.2 percent. Tuesdays 54.8 minutes, Fridays 47.7 minutes. 22.7 minutes at 8 a.m., with peaks of 60.1 minutes at both 11 a.m. and 1 p.m.
Star Wars Hyperspace Mountain came in at 32.3 minutes on average. Quietest February 6 with 16.2 minutes at 17.1 percent, busiest February 17 with 49.3 minutes at 69.2 percent. Saturdays 39.3 minutes, Fridays only 23.2 minutes. As low as 5.6 minutes at 8 a.m., up to 41.9 minutes at 11 a.m. Single Rider averaged 27.4 minutes and saved about 4.9 minutes overall, with the biggest gains on busy days like the 17th.
Buzz Lightyear Laser Blast averaged 35.5 minutes. Lowest on February 6 at 17.6 minutes, highest on February 17 at 51.3 minutes. Saturdays 39.6 minutes, Fridays 27.3 minutes. 6 minutes at 8 a.m., peaking at 48.3 minutes at 11 a.m.
Orbitron averaged 28.1 minutes, lowest on February 13 at 12.3 minutes, highest on February 17 at 42 minutes. Tuesdays 32.9 minutes, Fridays 23.5 minutes.
Dumbo the Flying Elephant averaged 24.6 minutes, lowest February 13 at 12.2 minutes, highest February 17 at 37.5 minutes.
Indiana Jones and the Temple of Peril averaged 22.9 minutes, lowest February 13 at 9.2 minutes, highest February 24 at 40.8 minutes. Single Rider saved an average of 9.9 minutes here.
Pirates of the Caribbean averaged 19.6 minutes, lowest February 6 at 6.1 minutes, highest February 17 at 29.6 minutes.
Phantom Manor averaged 15.3 minutes, lowest February 6 at 6.1 minutes, highest February 24 at 26.5 minutes.
it's a small world averaged 13.7 minutes, lowest February 11 at 5 minutes, highest February 17 at 21.6 minutes.
Mad Hatter's Tea Cups averaged 8.6 minutes, peaking at 12.9 minutes on February 24.
Star Tours: The Adventures Continue averaged 16.7 minutes, peaking at 25.2 minutes on February 24.
Thunder Mesa Riverboat Landing mostly hovered around 20 minutes.
Casey Jr. – le Petit Train du Cirque averaged 25.2 minutes, highest on February 24 at 39.5 minutes.
Le Carrousel de Lancelot averaged 9.7 minutes, highest February 4 at 12.8 minutes.
Le Pays des Contes de Fées averaged 10.3 minutes, highest on February 25 at 17.5 minutes with 57.9 percent crowds.
La Cabane des Robinson stayed at 5 minutes most days, only occasionally a bit higher.
Les Voyages de Pinocchio averaged 22.6 minutes, highest February 24 at 28.3 minutes.
Main Street Vehicles and Les Mystères du Nautilus remained at 5 minutes all month.
Disneyland Railroad averaged 23 minutes, while Autopia came in at 38.1 minutes with a peak of 59.6 minutes on February 17.
Overall, the thrill rides like Big Thunder Mountain and Autopia reacted far more strongly to holidays and mild weather, often exceeding 50-minute waits. The calmer attractions such as Alice's Curious Labyrinth or La Cabane des Robinson stayed rock-steady at 5 minutes. Single Rider at Star Wars Hyperspace Mountain and Indiana Jones saved 5 to 15 minutes on the busiest days. Peter Pan's Flight not only had the longest waits but also saw the biggest increases during the nationwide 100-percent holiday period.
Optimal Visiting Patterns and Practical Tips
Fridays were the clear winners with an average wait of just 17.4 minutes and 25.4 percent crowds, especially those before the holidays like February 6 and 13. Smart combinations included days with strong winds over 20 km/h or heavy rain over 50 percent – even during school breaks – such as February 11 and 12, when crowds were minimal. The best times park-wide were 8 to 9 a.m. (under 16 minutes) and after 8 p.m. (under 14 minutes). For Peter Pan's Flight, 8 a.m. (22.7 minutes) or after 9 p.m. worked great; for Big Thunder Mountain, 8 a.m. (16 minutes) or after 8 p.m. (under 30 minutes). Single Rider really paid off for Star Wars Hyperspace Mountain and Indiana Jones after 11 a.m., when regular lines exceeded 40 minutes.Planning tip: Keep a close eye on the holiday percentages. Before February 15, with only 33 percent in Zone A, nearly every day was very quiet to quiet. From February 15 with 66 percent – and especially from February 22 with 100 percent or 67 percent in B and C – arriving early or picking windy/rainy days (often under 40 percent crowds) made all the difference. Don’t forget the weather forecast either: Below 5°C or winds over 40 km/h frequently meant lighter crowds, even in holiday periods. On dry, mild late-month days like the 25th or 26th with over 57 percent crowds, the early or late slots were your best bet. Follow these patterns and you could dodge the longest lines on the big coasters every single day and enjoy the park with room to spare everywhere.
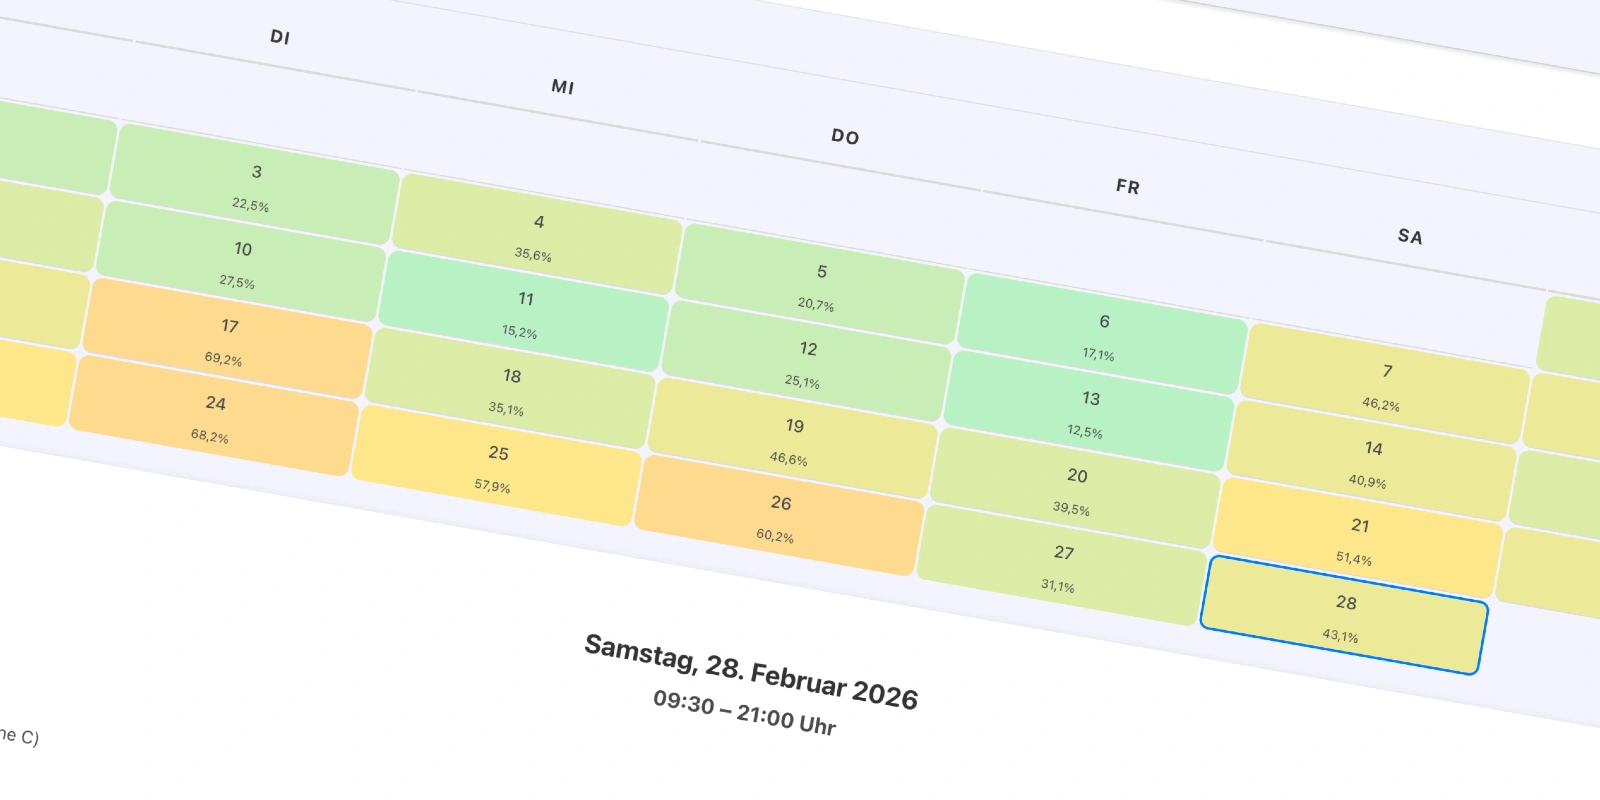
To the Crowd Calendar: Februar 2026