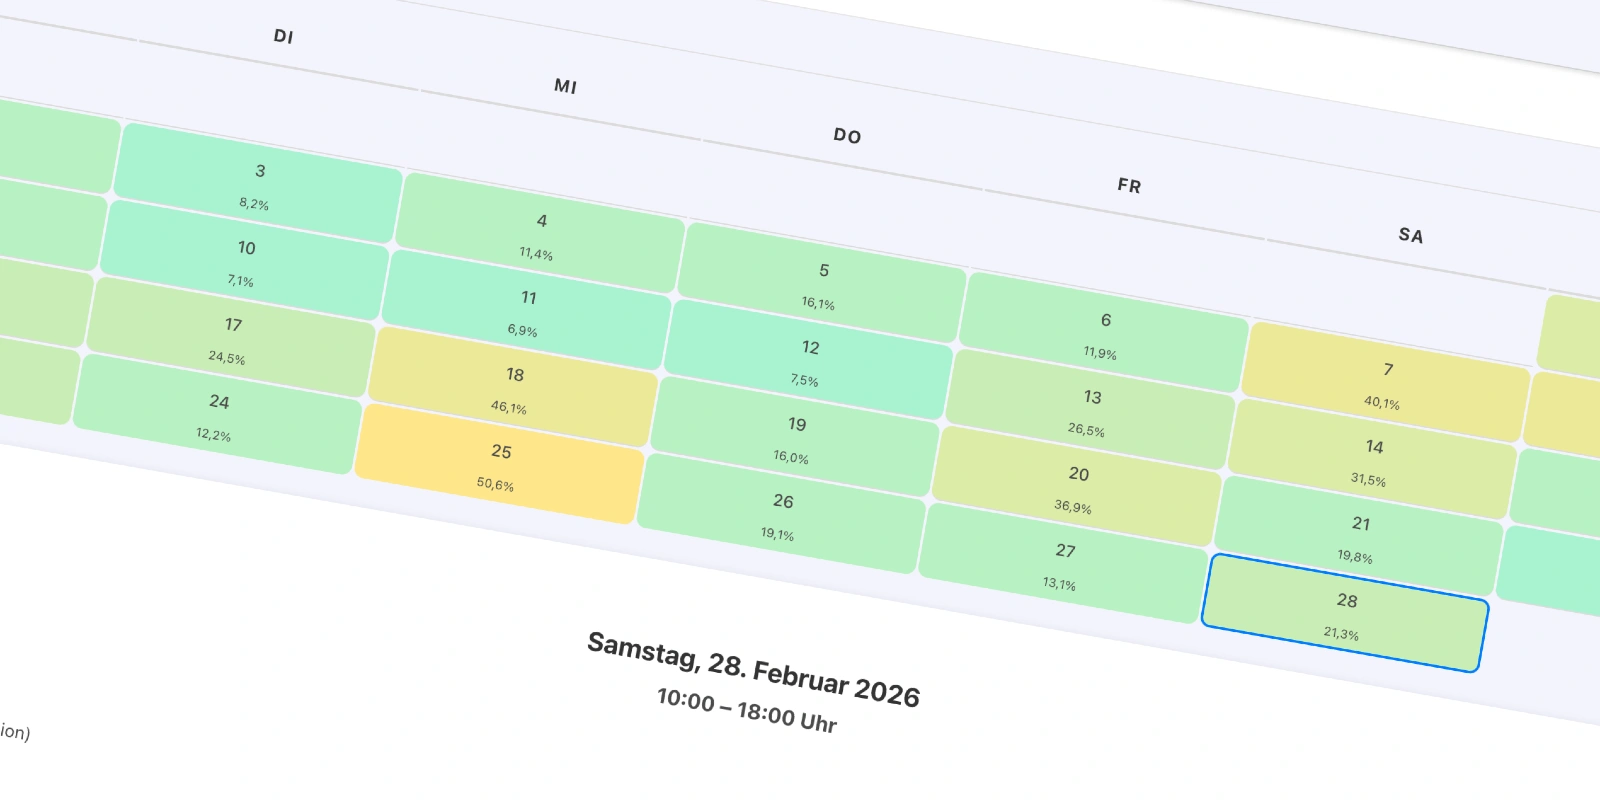
In February 2026 Efteling showed its particularly relaxed side and offered fans of the Dutch fairy tale park one of the quietest months in recent times. On most days crowd levels ranged from minimal to very low values between 6.9 and 25 percent. The lowest value was recorded on February 11 with only 6.9 percent. The highest value came on February 25 with 50.6 percent, which was an average day. Average wait times across the entire park ranged between 8.4 minutes on the quietest days and 21.5 minutes on the busiest days. Overall the month was excellently plannable for families because strong peaks were rare and usually only occurred with specific combinations of school holidays and weather.
External Influencing Factors
The only special day was February 14, Valentine’s Day – a festive day for 100 percent of the population in the Netherlands, but not a public holiday. On that day crowd levels stood at 31.5 percent, which was low, and wait times at 15.6 minutes – slightly higher than on normal days without special dates, but still far below peak values.The spring holidays shaped the month significantly. From February 14 to 20 the southern and central regions had spring break with 82 percent of students off. On those days crowd levels fluctuated between 24.2 percent on February 16 and 46.1 percent on February 18. From February 21 to 22 all students nationwide were on holiday. Here crowd levels were rather low with 19.8 percent on February 21 and only 9.1 percent on February 22. From February 23 onward only the northern region still had spring break with 18 percent of students off. On those days crowd levels ranged between 9.1 and 28.1 percent. The highest values during the holiday period always occurred when the 82-percent phase in the southern and central regions coincided with a weekend or good weather, as on February 18 with 46.1 percent.
Weather played a clear role. Days with temperatures above 10 °C were noticeably busier. On February 25 with 16.0 °C, 0 percent rain and 13.5 km/h wind the highest crowd level of the month was reached with 50.6 percent. On February 26 with 15.4 °C, 3.2 percent rain and 21.4 km/h wind it was still 19.1 percent. On February 24 with 11.8 °C, 49.1 percent rain and only 11.0 km/h wind crowd levels stood at 12.2 percent. Days with temperatures below 5 °C and strong wind almost always had minimal crowds. On February 3 with 1.6 °C, 46.0 percent rain and 41.1 km/h wind it was only 8.2 percent. On February 14 with 1.4 °C, 10.9 percent rain and 27.1 km/h wind it was 31.5 percent. On February 15 with 1.6 °C, 32.2 percent rain and 35.8 km/h wind it was 17.6 percent. Days with more than 50 percent rain and wind over 30 km/h almost always showed very low crowds, whether holidays or not. The quietest day, February 11, had 10.4 °C, 59.5 percent rain and 19.0 km/h wind and only 6.9 percent crowd level.
Weekly and Daily Rhythm
Wednesday was the strongest weekday with an average of 30.0 percent crowd level and 16.4 minutes wait time. Saturday reached 28.5 percent and 14.8 minutes, Sunday 26.3 percent and 14.5 minutes. The quietest weekdays were Tuesday with 13.9 percent and 10.6 minutes as well as Thursday with 14.8 percent and 10.8 minutes. Monday stood at 21.1 percent and 12.9 minutes, Friday at 22.3 percent and 13.2 minutes.During the day crowd levels were minimal at 9 a.m. with only 3.0 percent. From 10 a.m. they rose to 30.6 percent and stayed between 22 and 26 percent until 3 p.m. From 4 p.m. they slowly dropped to 20 percent and at 7 p.m. to 11.8 percent. Wait times followed similarly: only 5.8 minutes at 9 a.m., peak at 11 a.m. with 14.6 minutes, then slowly down to 8.0 minutes at 7 p.m. The best hours for short wait times were always right after park opening and from 5 p.m. onward.
Attractions in Detail
At Baron 1898 roller coaster wait times averaged 16.4 minutes. It was busiest on February 8 with 34.0 minutes and on February 25 with 33.1 minutes – both days with holiday shares and mild weather. It was quietest on several days with only 5.0 minutes, especially on February 3, 10, 11 and 12 with low temperatures and rain. On Saturdays and Sundays wait times were noticeably higher than on weekdays. The longest waits occurred on Saturdays between 11 a.m. and noon with up to 26.6 minutes. The Single Rider line saved a lot of time: the average here was 34.6 minutes, but only on days when the regular queue was full. On quiet days Single Rider brought hardly any advantage.Joris en de Draak averaged 24.8 minutes. Peaks were at 47.1 minutes on February 13 and 46.5 minutes on February 18 – both days with 82 percent holidays in the southern and central regions. On February 25 it was 33.6 minutes in perfect weather. It was quietest with 5.0 minutes on February 12. On Saturdays and Sundays wait times were highest at 28.4 and 28.3 minutes. The heatmap showed clear peaks on Saturdays around 2 p.m. with 32.4 minutes. Single Rider brought the average down to 17.4 minutes and helped especially on busy days like February 18 with 30.9 minutes instead of 46.5.
Symbolica averaged 24.2 minutes. On February 25 it was 37.0 minutes, on February 7 and 8 over 35 minutes each. On February 11 only 8.6 minutes. Saturdays 30.6 minutes, Sundays 27.9 minutes. Wait times rose quickly after 10 a.m. to over 28 minutes and stayed high until 4 p.m. Single Rider lowered the average to 7.1 minutes and was particularly effective on weekends.
Droomvlucht averaged 18.8 minutes. Peaks on February 8 with 35.2 minutes and on February 25 with 33.1 minutes. Saturdays 26.2 minutes. Longest waits on Saturdays around 3 p.m. with 34.0 minutes. Quietest on many days with only 5.0 minutes.
Fata Morgana was one of the shorter attractions with 8.3 minutes. Even on February 25 only 16.1 minutes. Wednesdays 10.8 minutes, Saturdays and Sundays around 10 minutes. Wait times mostly stayed under 12 minutes except Wednesdays at 11 a.m. with 15.9 minutes.
De Oude Tufferbaan averaged 15.3 minutes. On February 25 26.0 minutes, on February 20 23.8 minutes. Saturdays 18.4 minutes. Afternoons around 2 p.m. often over 20 minutes.
Max & Moritz averaged 12.9 minutes. On February 25 30.1 minutes, on February 18 28.7 minutes. Single Rider brought 8.2 minutes. The heatmap showed clear Saturday peaks around 11 a.m. with 26.6 minutes.
Python averaged 13.9 minutes (Single Rider 18.6 minutes). On February 7 34.4 minutes without Single Rider. On February 25 28.1 minutes. Saturdays 19.6 minutes.
Vogel Rok averaged 11.4 minutes. On February 16 27.6 minutes despite rain, on February 25 19.6 minutes. Saturdays 13.4 minutes.
Danse Macabre averaged 24.1 minutes. Very consistently high: on February 1 37.0 minutes, on February 18 38.6 minutes, on February 23 36.2 minutes. Even on quiet days rarely under 12 minutes. Saturdays 30.8 minutes. Single Rider averaged 8.3 minutes and helped enormously.
Stoomtrein (both stations) almost always had 19 to 25 minutes, independent of crowd levels. Only on Saturdays and Sundays wait times dropped to 13 to 16 minutes because more trains were running. Wait times were highest in the morning with 25 minutes at 9 and 10 a.m.
Gondoletta averaged 10.5 minutes. On February 25 24.6 minutes, otherwise mostly under 10 minutes.
Halve Maen averaged only 8.2 minutes. Even on February 25 only 19.1 minutes. The values were very consistently low.
Kinderspoor 9.9 minutes (22.1 minutes on February 25).
Pagode was almost always empty with 5.2 minutes, only on February 25 8.2 minutes.
Monorail 12.4 minutes (22.7 minutes on February 25).
Villa Volta 5.9 minutes (8.4 minutes on February 18).
Sirocco averaged 6.5 minutes (10.6 minutes on February 25).
Fabula always exactly 10.0 minutes.
The Six Swans 5.5 minutes.
Optimal Visit Patterns and Practical Tips
The best days were those with minimal crowds: February 11 (6.9 percent, 8.4 minutes), February 10 (7.1 percent), February 3 (8.2 percent), February 22 (9.1 percent) and February 4 (11.4 percent). On those days almost all attractions – including the big roller coasters – were under 10 minutes.If you keep an eye on holidays and weather, prioritize days with temperatures under 5 °C and rain or days after February 22 in the northern region phase with only 18 percent on holiday. The best hours are always right after opening until 10 a.m. and from 5 p.m. onward. Then wait times at almost all attractions drop below 10 minutes. Midday and afternoon between 11 a.m. and 4 p.m. are the busiest, especially on Wednesdays, Saturdays and Sundays.
For the big roller coasters like Baron 1898, Joris en de Draak, Symbolica and Danse Macabre Single Rider is almost always worthwhile on days over 25 percent crowd level – you often save half the time. On quiet days you do not need it. If you are traveling with children, Max & Moritz, Kinderspoor, De Oude Tufferbaan and the Stoomtrein are almost without wait time on quiet days. The Stoomtrein is longest in the morning, shorter in the afternoon.
In summary: Watch for temperatures over 10 °C and rain under 20 percent – then it can get busier. On all other days, especially weekdays or after February 22, you practically have Efteling to yourself. The combination of the end of spring break in the southern and central regions plus bad weather brought the quietest days. Anyone who is flexible and checks the forecast will almost always find a day in February 2026 with very low wait times at all attractions.
To the Crowd Calendar: Februar 2026