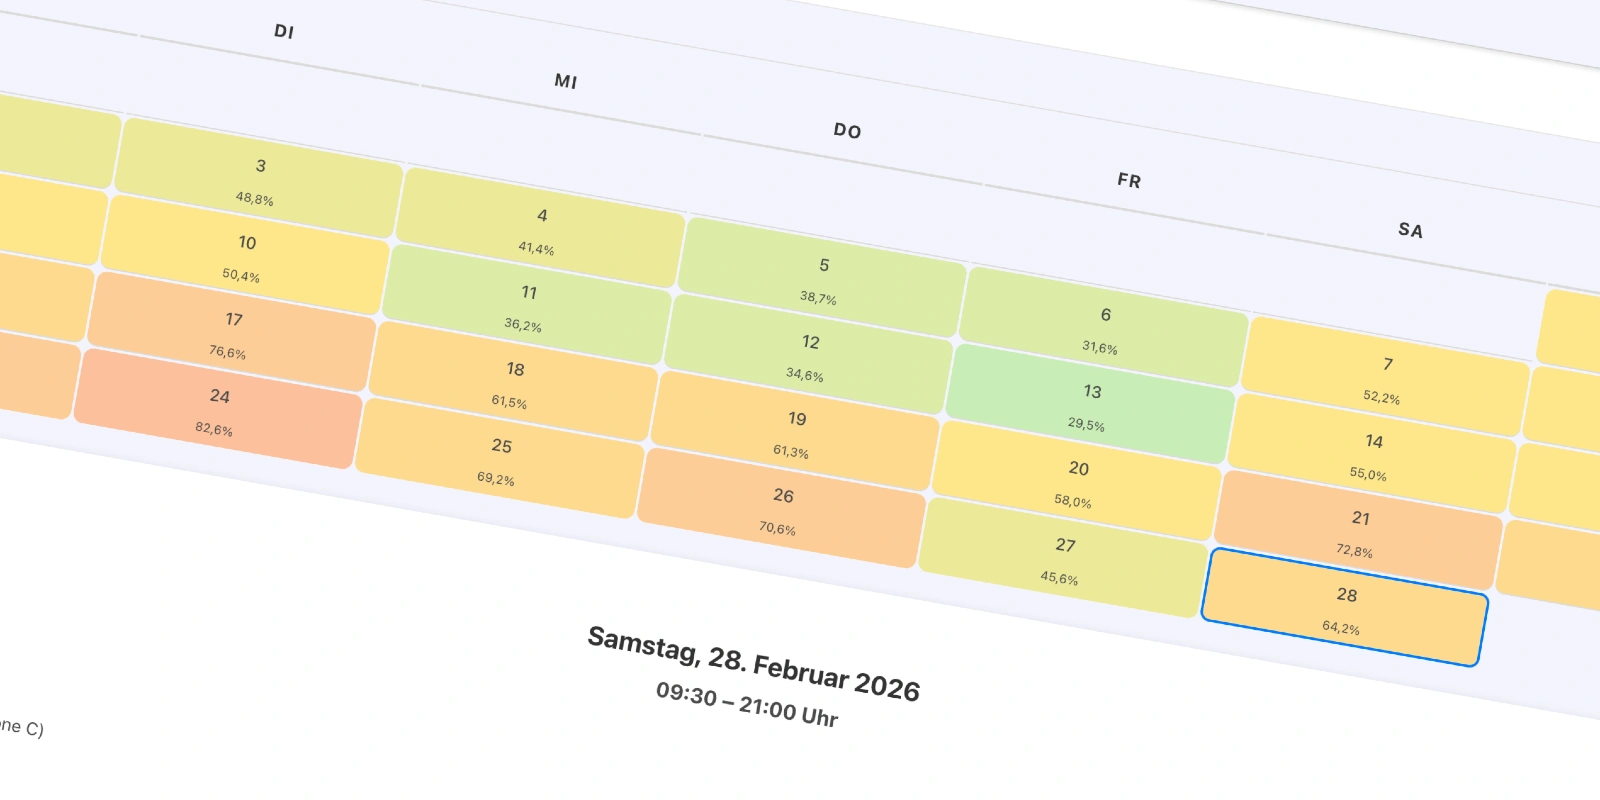
In February 2026, Disney Adventure World clearly demonstrated how much school breaks, weather, and weekdays shape crowd levels. With an average capacity of 55.1 percent and exactly 29 minutes wait time, the park stayed pleasantly moderate overall – ideal for anyone who plans ahead and wants to skip long lines. The first two weeks were mostly calm to average, with waits between 20 and 29 minutes. The quietest day was February 13, at just 29.5 percent capacity and 20 minutes average wait. From mid-month, crowds picked up noticeably, peaking on February 24 at 82.6 percent capacity with 39.6 minutes wait time. By the end of the month things eased off again, as on February 27 with 45.6 percent.
Holidays, Weather and School Breaks as Key Drivers
Valentine’s Day on February 14 affected 100 percent of France’s population but wasn’t a public holiday. Still, crowds stayed moderate at 55 percent capacity with 27.6 minutes wait – barely different from a regular day. The French winter school holidays had far more impact. From February 8 to 14, 33 percent of Zone A students were on break, keeping crowds mostly between 50 and 56 percent, like 56.1 percent on February 8 or 55 percent on the 14th. Before that, from February 1 to 7 with no breaks, crowds were often lower than average – for instance 31.6 percent on February 6. After February 15 the share rose to 66 percent in Zones A and B, and crowds grew accordingly, reaching 68.2 percent on the 16th or 76.6 percent on the 17th. On February 22 all students nationwide were on break, with 63.1 percent capacity. Zones B and C then stayed at 67 percent until the end of the month. On those high-break days capacity often hit 60 to 82 percent, for example 73.1 percent on February 23, 82.6 percent on the 24th or 70.6 percent on the 26th. Compared with days at only 33 percent in Zone A or no breaks at all, the difference was striking.Weather played a big role too. On days with over 30 percent chance of rain, average capacity dropped to 48.6 percent and waits to 26.8 minutes. Think February 13 with 77.8 percent rain chance, 8.2 degrees and 10 km/h wind at just 29.5 percent capacity, or February 3 with 62.1 percent rain at 48.8 percent. With moderate rain (11 to 30 percent) capacity was 61.6 percent and waits 31.2 minutes, as on February 23 with 27.9 percent rain at 73.1 percent or February 28 with 19.6 percent rain at 64.2 percent. On nearly dry days with 10 percent rain or less, capacity reached 65.3 percent and waits were 33 minutes – like February 8 with 1.9 percent rain at 56.1 percent, February 25 with 1.1 percent at 69.2 percent or February 26 with 1.2 percent at 70.6 percent. Wind made a difference as well: under 10 km/h capacity averaged 69.3 percent with 34.5 minutes wait, seen on February 24 with 9 km/h at 82.6 percent or February 25 with 7.6 km/h at 69.2 percent. Moderate wind (10-20 km/h) brought 53.5 percent capacity and 28.5 minutes wait. Strong wind over 20 km/h meant 53.2 percent and 28.2 minutes, as on February 11 with 45.1 km/h at 36.2 percent or February 12 with 49.7 km/h at 34.6 percent. At 5 degrees or colder, capacity was 55.6 percent with 28.4 minutes wait, for example February 14 at 1.5 degrees and 55 percent or February 15 at 2.3 degrees and 56.3 percent. Warmer days above 5 degrees saw 55.1 percent capacity and 29.1 minutes wait. The busiest combinations were high break percentages plus dry weather, mild temperatures over 13 degrees and light wind – exactly what happened on February 24 with 67 percent students in Zones B and C, 13.3 degrees, 11.8 percent rain and 9 km/h wind at 82.6 percent capacity.
Weekly and Daily Patterns – Your Perfect Planning Guide
Crowds followed a clear weekly pattern. Fridays were quietest at 41.6 percent capacity with 24.5 minutes wait. Mondays came in at 59 percent and 30.2 minutes. Tuesdays were busiest with 66.4 percent and 32.9 minutes. Wednesdays and Thursdays hovered around 52 percent with 28.4 minutes. Saturdays hit 61 percent and 30.5 minutes, Sundays 57.4 percent and 30 minutes. Wait times always matched the crowds perfectly.The daily rhythm was just as predictable. At 8 a.m. capacity was 31.1 percent with only 17.4 minutes wait. By 9 a.m. it rose to 56.2 percent and 27.4 minutes. Peak hit at 10 a.m. with 68.2 percent and 36.8 minutes, followed by 11 a.m. at 66 percent and 42.6 minutes. Then it dropped: 58.8 percent and 37.8 minutes at noon, 53.5 percent and 33 minutes at 1 p.m., 60.6 percent and 31.7 minutes at 2 p.m. At 3 p.m. it was still 66.5 percent and 31.8 minutes. From 4 p.m. it fell to 58.3 percent and 28.8 minutes, 54.7 percent and 24.6 minutes at 5 p.m., 52.7 percent and 22.6 minutes at 6 p.m. At 7 p.m. 44.5 percent and 19.1 minutes, 8 p.m. 34.8 percent and 12.7 minutes, 9 p.m. 20.4 percent and 8 minutes. Shortest waits were right at opening or from 7 p.m. onward. Longest always between 10 and 11 a.m.
Attraction Wait Times in Detail
Crush’s Coaster averaged 75.1 minutes. Single Rider cut it to 50 minutes. The longest wait was on February 24 with 97.7 minutes – 67 percent students in Zones B and C, dry weather at 13.3 degrees, 11.8 percent rain chance and light 9 km/h wind. Shortest on February 6 at 61.6 minutes and February 12 at 58.6 minutes with low crowds and only 33 percent in Zone A. Tuesday saw 82.3 minutes highest, Friday 69.4 minutes lowest. During the day it climbed from 59 minutes at 8 a.m. to 92.6 at 9 a.m., 95.3 at 10 a.m. and 90.6 at 11 a.m., then gradually fell to 23.3 minutes by 9 p.m. The heatmap peaked Tuesday at 11 a.m. with 103.2 minutes and Monday at 10 a.m. with 97.9 minutes.RC Racer averaged 37.4 minutes, Single Rider 26.9 minutes. Highest on February 26 with 48.3 minutes and February 24 with 48.1 minutes during high break periods and dry weather. Lowest on February 13 with 25.5 minutes in low crowds and heavy rain. Tuesday highest at 41.1 minutes, Friday lowest at 31.9 minutes. It rose from 20.4 minutes at 9 a.m. to 54.1 at 11 a.m. and 51.4 at noon, then dropped to 6.7 minutes by 9 p.m.
The Twilight Zone Tower of Terror averaged 49.7 minutes. Highest on February 24 at 68.2 minutes in peak crowds, lowest on February 13 at 31.8 minutes. Tuesday 54.9 minutes highest, Friday 41.7 minutes lowest. Rose from 28.4 minutes at 8 a.m. to 63.4 minutes at 11 a.m., then down to 15 minutes by 9 p.m.
Toy Soldiers Parachute Drop averaged 38.2 minutes, Single Rider just 12.9 minutes. Highest on February 24 at 46.7 minutes, lowest on February 14 at 29.7 minutes. Tuesday 42.8 minutes highest, Sunday 35.7 minutes lowest. From 30.6 minutes at 9 a.m. to 52.9 at 11 a.m., then down to 8.5 minutes by 9 p.m.
Slinky Dog Zigzag Spin averaged 10.3 minutes. Highest on February 24 at 16 minutes, lowest on February 1 at 6.1 minutes. Tuesday 12.7 minutes highest, Friday 8.9 minutes lowest. Rose from 5 minutes at 8 a.m. to 22.6 minutes at 11 a.m., then dropped fast.
Cars ROAD TRIP averaged 10.7 minutes. Highest on February 21 at 14.6 minutes with 66 percent on break, lowest on February 3 at 5 minutes. Tuesday highest at 12.5 minutes. Rose from 6 minutes at 9 a.m. to 25.3 at 11 a.m. and stayed around 10 minutes in the evening.
Les Tapis Volants – Flying Carpets Over Agrabah averaged 11.9 minutes. Highest on February 24 at 18.8 minutes, lowest on February 3 at 6.8 minutes. Tuesday highest at 14.2 minutes. From 5.1 minutes at 8 a.m. to 24 minutes at 11 a.m.
Cars Quatre Roues Rallye averaged 13 minutes. Highest on February 21 at 20.9 minutes, lowest on February 13 at 7 minutes. Monday highest at 15.2 minutes. From 5 minutes at 8 a.m. to 25.5 minutes at 11 a.m.
Avengers Assemble: Flight Force averaged 25.1 minutes, Single Rider 16.6 minutes. Highest on February 24 at 41.4 minutes, lowest on February 6 at 11 minutes. Tuesday 31.1 minutes highest, Friday 16.3 minutes lowest. From 5.1 minutes at 8 a.m. to 41.5 at 11 a.m.
Spider-Man W.E.B. Adventure averaged 42.3 minutes, Single Rider 14.9 minutes. Highest on February 15 at 58.6 minutes as break percentages rose, lowest on February 13 at 27.6 minutes. Sunday highest at 47.2 minutes. From 9.4 minutes at 8 a.m. to 62.3 at 11 a.m.
The attractions behaved differently. Crush’s Coaster, The Twilight Zone Tower of Terror and Spider-Man W.E.B. Adventure had the longest waits and spiked on high-break and dry days. Slinky Dog Zigzag Spin and Cars ROAD TRIP stayed short throughout. Single Rider saved roughly 25 minutes on Crush’s Coaster, 10 on RC Racer, 8 on Avengers Assemble, 27 on Spider-Man W.E.B. Adventure and 25 on Toy Soldiers Parachute Drop. Single Rider was shorter every single day.
Best Visit Patterns and Practical Tips
Best days to visit were Fridays at only 41.6 percent capacity with 24.5 minutes wait, or other quiet ones like February 13. February 27 at 45.6 percent was great too. Steer clear of days with 66 percent or more on break plus dry, low-wind weather – that’s when it got really busy. Check the school holiday calendar and target low student percentages or anything before February 15. For weather, go for over 30 percent rain chance or strong winds, when crowds were lighter.Prime times in the park: opening at 8 a.m. with just 17 minutes wait or evenings from 7 p.m. with under 20 minutes. Skip the 10-to-11 a.m. slot when waits peaked. For Crush’s Coaster, hit it early or late – the heatmap showed the lowest numbers then. Same for all coasters. Definitely use Single Rider on Crush’s Coaster, RC Racer, Avengers Assemble: Flight Force, Spider-Man W.E.B. Adventure and Toy Soldiers Parachute Drop to save serious time. Schedule big rides for morning or evening and smaller ones around midday. That way you’ll have space everywhere and clear paths. Factor in the holiday calendar plus the forecast for temperature, rain and wind, and your visit will line up perfectly with the quietest crowds.
To the Crowd Calendar: Februar 2026