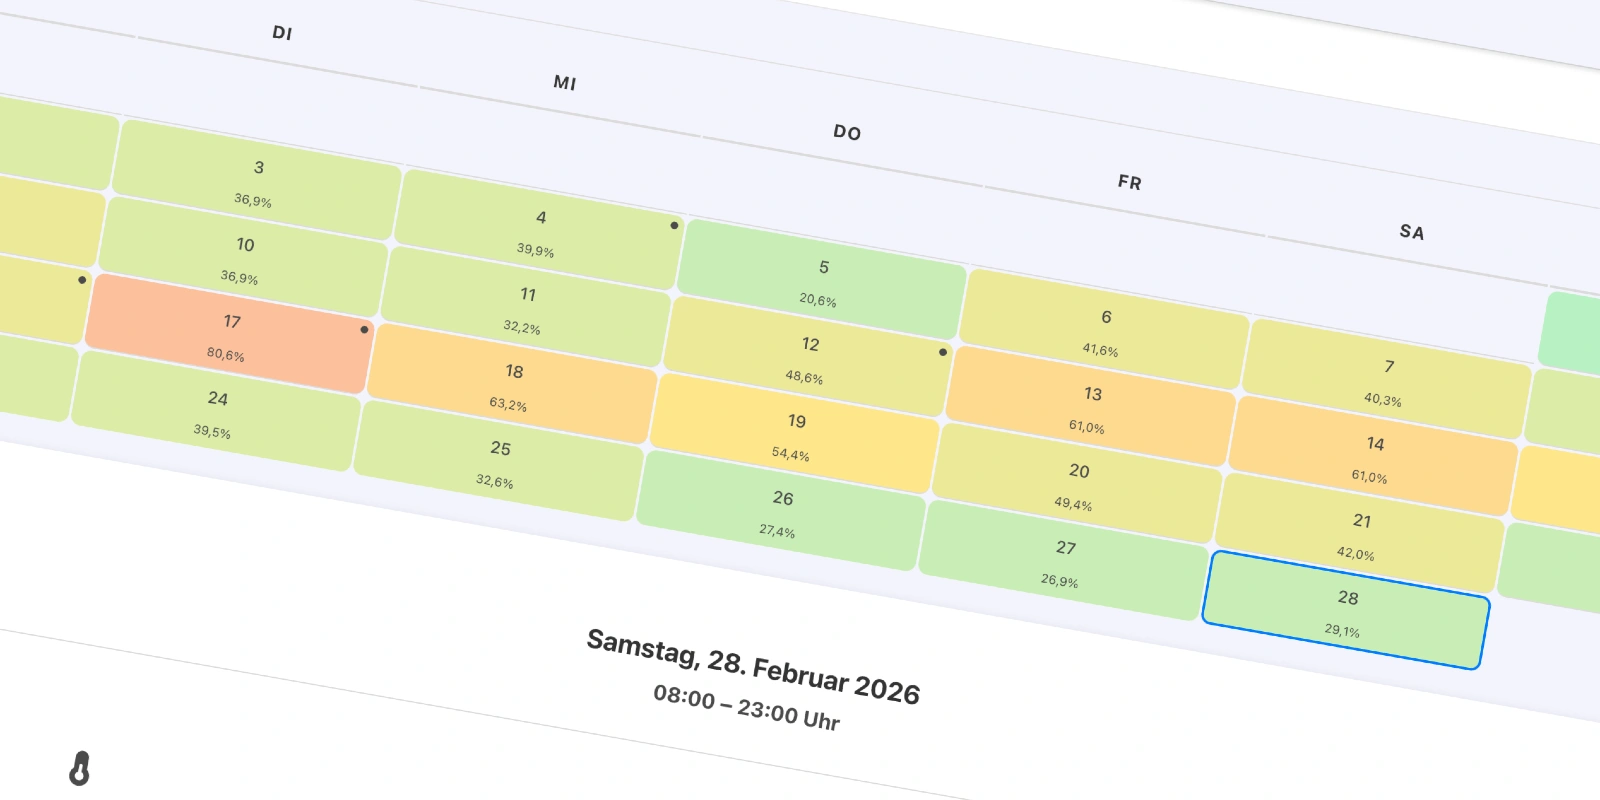
February 2026 at Magic Kingdom Park delivered some of the most extreme contrasts of the year – exactly the kind of month that keeps real fans on their toes when planning a visit. The month kicked off on February 1 with an extremely low 17.1 percent capacity and an average wait time of just 17.5 minutes. Then came Fat Tuesday, February 17, when crowds surged to 80.6 percent and waits climbed to an average of 35.4 minutes – the highest of the entire month. Overall, the February average wait time landed around 23 minutes. Those big swings between 17.5 and 35.4 minutes made one thing perfectly clear: holidays and weather called all the shots.
The combination of holidays and weather conditions played a particularly big role. On National Freedom Day (February 1), a holiday for 100 percent of the U.S. population, the park stayed nearly empty. Groundhog Day on February 2 was similarly quiet. Moderate crowds turned up on Rosa Parks Day (February 4) and Lincoln’s Birthday (February 12). The real peak hit on Fat Tuesday (February 17), a legal holiday for 20 percent of the population, paired with ideal weather: 21.2 degrees Celsius, just 3.7 percent chance of rain, and light winds of 12.2 km/h. The following day, Ash Wednesday (February 18), still saw somewhat elevated crowds at 63.2 percent. Colder or windier days with temperatures below 10 degrees Celsius, more than 20 percent rain chance or winds over 30 km/h drew noticeably fewer visitors – as seen on February 1, 5, 22, and 23.
Weekly and Daily Rhythm at Magic Kingdom Park
Crowds followed a clear weekly pattern. Tuesdays topped the list with 49.6 percent capacity and 27.1-minute waits, while Sundays were the quietest at 32.4 percent. Throughout the day, attendance ramped up sharply from 7 a.m. onward (reaching 54.6 percent), hit its peak around noon (49.6 percent with 29.7-minute waits), and dropped off after 3 p.m. – especially after 8 p.m. On holidays like February 17 the energy stayed higher well into the evening, whereas cold, windy days like February 1 cleared out much earlier in the afternoon.Attraction Details – Wait Times and Patterns
Every attraction responded in its own way to the overall crowd levels, holidays, and weather. Under the Sea ~ Journey of The Little Mermaid averaged 18.1 minutes across the month, peaking at 30.4 minutes on February 17 and dropping to just 6.5 minutes on the 1st. Meet Cinderella and a Visiting Princess at Princess Fairytale Hall averaged 30.4 minutes, climbing to 42.2 minutes on the busiest day. The Barnstormer came in at 20.7 minutes (33.5 minutes on February 17), and Pirates of the Caribbean averaged 23.1 minutes (34.4 minutes). Seven Dwarfs Mine Train was among the longest waits, averaging 58.9 minutes and reaching 78.5 minutes on Fat Tuesday. Meet Princess Tiana and a Visiting Princess at Princess Fairytale Hall averaged 23.8 minutes (34.8 minutes on the 17th). “It’s a Small World” sat at 16.6 minutes (29.3 minutes), while Jungle Cruise averaged 41.6 minutes (58.9 minutes on peak day). The Haunted Mansion needed 30.3 minutes (38 minutes), and The Many Adventures of Winnie the Pooh 36.6 minutes (44.2 minutes). Astro Orbiter averaged 22.1 minutes, but Walt Disney’s Carousel of Progress stayed rock-solid at exactly 5 minutes no matter the day or time. Mickey’s PhilharMagic averaged 11.7 minutes, and Country Bear Jamboree was almost always around 10 minutes. Monsters Inc. Laugh Floor came in at 10.3 minutes, Tomorrowland Speedway at 14.9 minutes, and Walt Disney’s Enchanted Tiki Room at 10 minutes. The Tomorrowland Transit Authority PeopleMover averaged 11.1 minutes, and Swiss Family Treehouse stayed at 5 minutes throughout. The Hall of Presidents held steady at 15 minutes, Prince Charming Regal Carrousel at 9.9 minutes. Meet Mickey at Town Square Theater averaged 23.3 minutes, Dumbo the Flying Elephant 18.6 minutes, and Mad Tea Party 12.2 minutes. Peter Pan’s Flight averaged 44.6 minutes (59.1 minutes on February 17), Space Mountain 44.4 minutes (up to 106 minutes on the peak day). The Magic Carpets of Aladdin averaged 19.2 minutes, and Meet Ariel at Her Grotto averaged 30.5 minutes. TRON Lightcycle / Run took the crown with an average of 74.3 minutes and a staggering 104.4 minutes on February 17, making it by far the longest-wait attraction in the park. Enchanted Tales with Belle averaged 23.7 minutes, the Walt Disney World Railroad in Fantasyland 21.4 minutes, the Main Street version 19.9 minutes, and Tiana’s Bayou Adventure 35.2 minutes (peaking at 68.5 minutes).The pattern was consistent across the board: significantly longer waits on February 17, minimal waits on quiet days like February 1, clear midday peaks, and the biggest advantages for early-morning or late-evening visits.