Fans who visited Disney California Adventure Park in February 2026 know the truth: some days the park was nearly empty, while on others it felt like pure Valentine's Day chaos with waits of over two hours for the big coasters. The data clearly shows that holidays and weekends drove massive crowd spikes – especially on February 14, 15, and 21. Smart planners could still enjoy dream days with average waits under 20 minutes. Here's the full breakdown every Disney fan needs ahead of 2027.
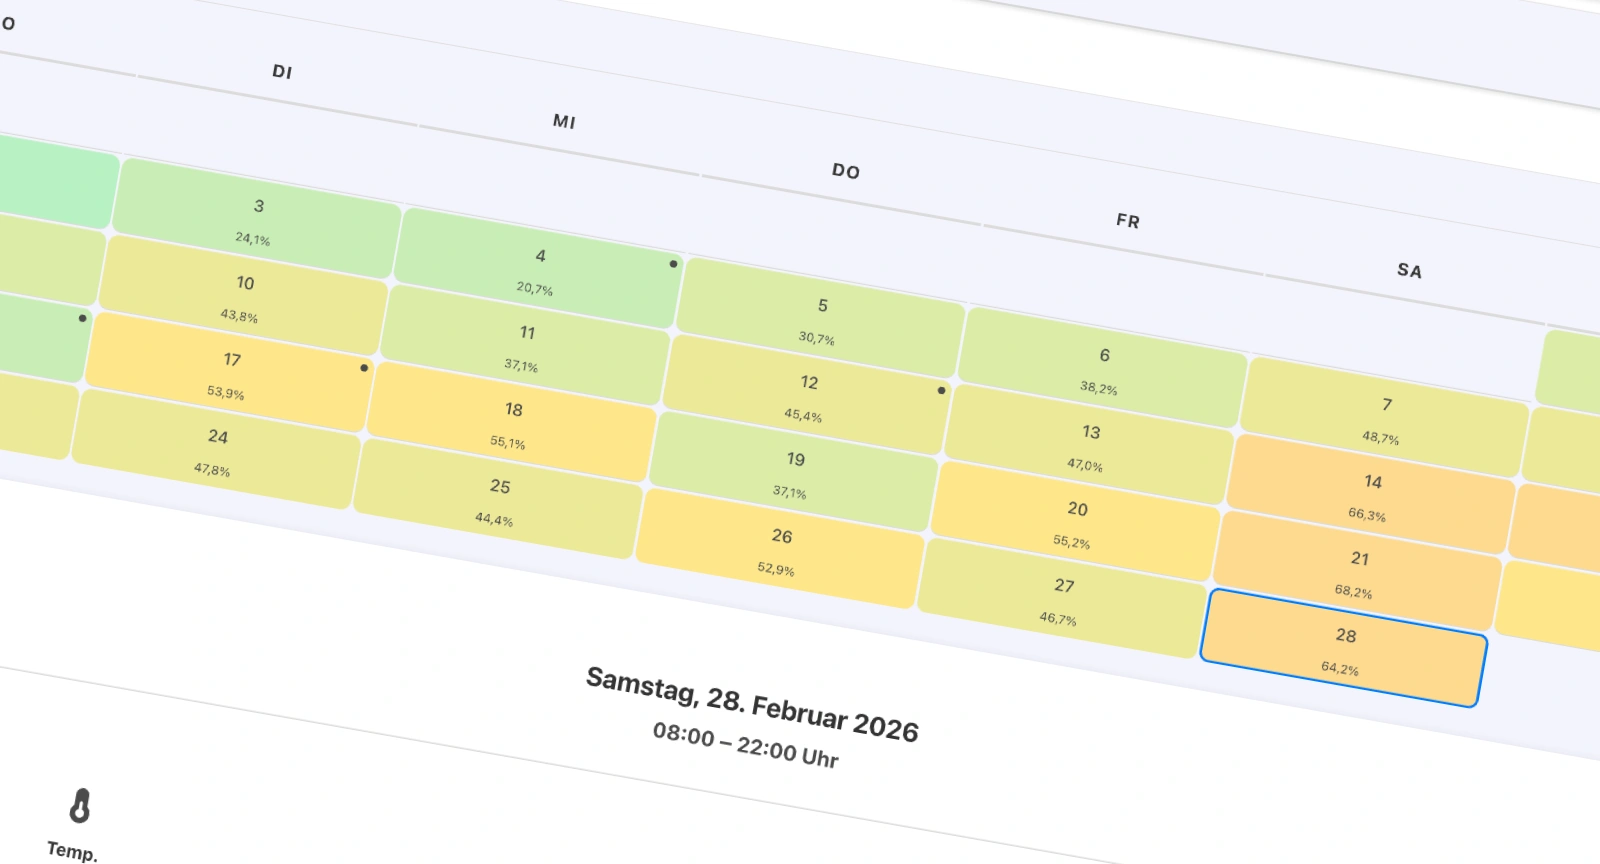
The month started quiet and picked up significantly from mid-February onward. The lowest crowds were on February 2 at just 18.1 percent with an average wait of only 17.8 minutes across all attractions. The peak came on February 21 with 68.2 percent and 40.9 minutes average wait. Around Valentine's Day the numbers exploded: 66.3 percent on the 14th (43.7 minutes) and 68.1 percent on the 15th. February 28 still hit a strong 64.2 percent. The monthly average sat around 43 minutes. Good weather – over 20°C with almost no rain and light wind – amplified holiday effects dramatically, while one single wet and windy day completely canceled out even a 100-percent holiday.
The impact of the various holidays was particularly interesting. National Freedom Day (February 1) and Groundhog Day (February 2) brought only moderate to very low crowds despite being 100 percent population holidays. Rosa Parks Day (February 4) and Lincoln's Birthday (February 12) stayed quiet as well. Valentine's Day (February 14) with 100 percent and the day after then caused the biggest swings. George Washington's Birthday on February 16 dropped to just 23.4 percent because of heavy rain and strong winds. Fat Tuesday and Ash Wednesday landed in the middle range. The winning formula for busy days was clear: dry, mild weather combined with a strong holiday.
The weekly pattern was exactly as expected. Mondays with 29.8 percent crowds and 23.4-minute waits were the most relaxed, while Saturdays at 61.8 percent and 39 minutes were the busiest. Within each day, waits rose sharply from 9 a.m., peaked between 3 p.m. and 7 p.m. at up to 35.8 minutes, and dropped again after 8 p.m. The lowest point came at 11 p.m. with 13.4 minutes.
The biggest swings happened on the major thrill rides. Radiator Springs Racers averaged 83.6 minutes, with peaks of 119.8 minutes on February 15 and 108.1 minutes on Valentine's Day. Saturday evenings saw waits of up to 119 minutes. Guardians of the Galaxy – Mission: BREAKOUT! averaged 79.7 minutes, hitting 113.3 minutes on the 15th with evening spikes up to 133 minutes. Incredicoaster (50.8 minutes), Soarin’ Over California (48.5 minutes), and Toy Story Midway Mania! (48.2 minutes) followed. Calm attractions like Mickey’s PhilharMagic stayed rock steady at 10 minutes regardless of holidays or weather.
For next February, keep this in mind: February 2, 4, and 16 were the quietest days, with nearly everything under 30 minutes. The first two hours after opening from 8 a.m. were pure gold even on busy days. For Radiator Springs Racers and Guardians, target 8 to 10 a.m. or after 9 p.m. When rain exceeded 30 percent and winds were over 20 km/h, waits stayed low all day – perfect for coaster fans. Skip Saturdays whenever possible, always check the weather forecast, and arrive early. Do that, and every February visit to Disney California Adventure Park will be a success.
Ups! Twoja przeglądarka lub sieć blokuje nasze reklamy.
Wyłącz blokadę reklam, abyśmy mogli utrzymać działanie serwisu. Możesz też wesprzeć nas przez PayPal, Ko-fi, LiberaPay lub zakupy z naszego linku partnerskiego Amazon.
Dziękujemy za wsparcie!
Wyłącz blokadę reklam, abyśmy mogli utrzymać działanie serwisu. Możesz też wesprzeć nas przez PayPal, Ko-fi, LiberaPay lub zakupy z naszego linku partnerskiego Amazon.
Dziękujemy za wsparcie!